Track Record 01System 02The Court 03About 04Live Statement MYFXBOOK · LIVE ↗
Consultationنسخه فارسی
HomeProof
Track record

The live track record, the 33% drawdown and how it is verified

Every number on this site is read from one real account connected to Myfxbook. This page dissects that account: the peak, the drawdown, the floor — and why none of it is self-reported.

01 / PROOF

Anatomy of the Most Painful Drawdown

A technical autopsy of the 33% drawdown — a drawdown that never touched the initial capital

In the golden age of beautiful lies, we are bombarded by fake screenshots and fabricated equity curves. Real professional trading is not about quick profits; it is about mastering loss-management protocols and the ability to fully recover from deep crises.

Key fact

The 33% drawdown never touched the principal. The account first climbed to about +145%, then pulled back to +64% — the lowest point of the entire drawdown. Even at the bottom of the crisis, the account was 64% above starting capital. From there, without changing a single rule, the system carried it to an all-time high of +176%; it currently stands around +167%. In 48+ months the balance has never — not for a single day — dropped below initial capital.

START0%FIRST PEAK+145%DRAWDOWN FLOOR+64%ALL-TIME HIGH+176%NOW+167%

At a 33% drawdown, in our estimate* the vast majority of retail traders lose the account irreversibly — either by freezing and abandoning the system, or by revenge-trading with multiplied size. This system did neither. Without increasing risk, without injecting capital, and purely by executing its rules, it recovered the full drawdown and carried the account to a peak of +176% net gain. After a natural pullback it currently sits around +167% — the exact live figure is always visible on the Myfxbook link.
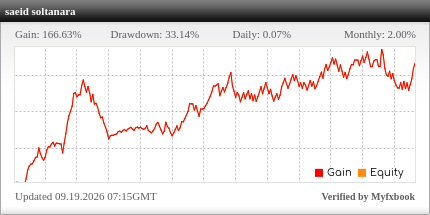
Live Historical Equity Chart
Live Myfxbook chart

100% Mechanical · Zero Discretion means: entry, stop-loss, take-profit, position size and risk management are all derived from pre-written rules; the trader makes no discretionary decision in executing any trade. The only human involvement is manually placing the orders the system dictates (the account is registered as Manual on MT4) — which is exactly what is inspectable on Myfxbook.

VERIFICATION METHODOLOGY

How the numbers are verified — and why we don't rely on self-reporting

No figure on this site comes from a screenshot or a spreadsheet. Every performance number is read from the live account connected to Myfxbook, and all of them use the Gain column on that page as their basis (not Absolute Gain, not momentary equity).

Track Record Verified
Myfxbook connects several times a day directly to the broker's server with a read-only investor password, downloads the original trade history and compares it with what is displayed; any discrepancy is overwritten with the broker's data. Myfxbook's official explanation ↗
Trading Privileges Verified
Ownership is proven by opening a trade that carries a unique key issued by Myfxbook — so nobody can publish someone else's track record with a borrowed investor password.
Basis of the figures
Net Gain = the Gain column on Myfxbook (time-weighted, independent of deposits/withdrawals). Peak = the highest value of that column. Max DD = the Drawdown column. Start 2022; Real account, Windsor Brokers, MT4, 1:100 leverage.
Check it yourself
Public account page ↗ — both green ticks, trade history, drawdown and growth curve, no sign-up required.
OPEN CHALLENGE

We don't claim. We ask for evidence.

We do not say "no other system in the world has done this" — that sentence would require auditing the entire global market, and nobody can prove it. Instead we ask one precise question and publish the criteria, so anyone can run the search themselves.

1 · The claim

A fully mechanical system, after more than 4 years live, recovered from a 33% drawdown (which never went below initial capital) without capital injection and without changing its rules, and reached a net gain of +167% (peak +176%).

2 · Measurable criteria
  • Live statement (not demo, not backtest)
  • At least 4 years of continuous history
  • Third-party verification (Track Record + Trading Privileges)
  • Mechanical / algorithmic strategy with written rules
  • Maximum drawdown in the ~33% range
  • Full recovery from that drawdown
  • No capital injection used to shape the curve
  • No fundamental rule change along the way
  • Net gain in the +150% to +180% range (currently +167%, peak +176%)
  • Data publicly inspectable without sign-up
3 · Where to look

These platforms are listed only as places to search; naming them does not endorse or recommend any system or service hosted there.

4 · Found one?

Know an account that meets all 10 criteria at once? Send us its public link. If it passes, we will publish it here by name and amend this page. Until then, our claim is exactly this: "In the public, verifiable sources we know of, no example meeting all of these criteria simultaneously has been brought to our attention." No more, no less.

Submit an example (Telegram)